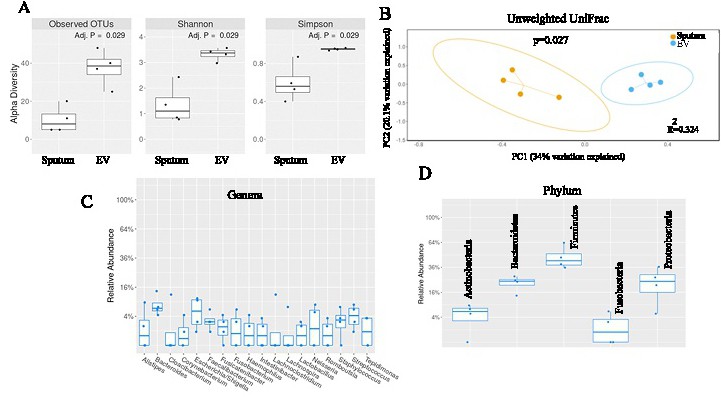
Fig. 7. Alpha and beta diversity ordination plots. (A) Measurement of the intra-sample diversity by alpha diversity method. The alpha diversity metrics use the counts (richness) and distribution (evenness, Shannon Index) of the OTUs within a sample as the basic values for these calculations. (B) Measurement and comparison of beta diversity in various groups using weighted UniFrac (phylogenitic) distance metrics. Data were plotted using PCoA ordination method utilizing the OTUs as the basic units. The percentage of variability of each principal coordinates (PC) has been explained on the axis of the plot. Each colored circle represents a sample from a group, as indicated. The probability distribution has been represented by the ellipses. (C-D) Exclusive abundance of various genera and phyla in the circulating exosomes. A minimum average abundance of 1% was considered for the categorization of the top taxa.